What would judicial reality look like if Segal/Cover scores perfectly predicted the liberal tendencies of the justices? Just so there is no confusion, note that one might approach a question like this from “two ends.” One could simply change the Segal/Cover scores so that they perfectly matched the career-liberal ratings of justices in civil liberties cases – creating, in essence, a logit model that regresses career percentages against justice votes – or one could change liberal ratings to reflect what Segal/Cover scores purport to say about them (in theory). It is the latter transformation that I will undertake in this entry. (The former will be undertaken later).
To do this one must ask a central question: if justices voted exactly according to their newspaper reputation for political direction, what would that look like? One answer might be that a perfect match occurs when the propensity for bias found in the reputation has a one-to-one correspondence with the propensity for bias found in the actual votes. Hence, perfect prediction might simply be the scaled Segal/Cover scores.[1] A justice having a Segal/Cover score of 0, therefore, would be expected to have a liberal output of 50% if newspaper reputation perfectly measured and predicted an aggregate directional tendency.[2] (For those who object that perfect prediction would not exist using one-to-one proportionality, hold off for just a second).
So what would reality look like if Segal-Cover scores were perfectly accurate, using one-to-one proportionality? To answer this question, I have conducted a logistic regression of simulated data for all civil liberties votes cast for all justices from 1946-2004. (The data is uploaded on this website and can be accessed below). It was fairly easy to create the simulated votes. I simply changed the vote distribution of each justice in my real data set so that the proportion of liberal votes matched perfectly the scaled Segal/Cover score. For example, Justice White has 2,307 votes in the data set and his Segal/Cover score is 0 (scaled to .5); therefore, his vote distribution was changed to 1154 liberal, 1154 conservative.
The results of the regression are quite interesting and can be found in the following table. As one can plainly see, this regression is immaculate. They should put it in an attitudinal museum. The likelihood-ratio R-squared is .38, which is an excellent number for a bivariate ideology model.[3] According to PRE (tau-p), knowing the newspaper reputation of a justice increases the ability to classify votes by 59%. Phi-p indicates that the overall voting variance accounted for by the model is about 59% as well, which is the level of explanation that Segal and Spaeth originally thought they had created with ecological regression. The regression coefficient also supports a rosy scenario. The KDV shows that when Segal-Cover Scores change from -1 (most conservative) to +1 (most liberal), the discreet change in the probability of obtaining liberal votes increases by .9999, a near perfect match.[4] The only way this model can become better as far as goodness of fit is concerned is to eliminate the perfectly non-directional justices having “neutral” political reputation (White, Whittaker and Clark).
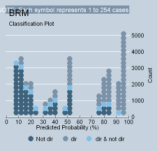
To see why this model performs so well, examine the classplot below. As one can plainly see, the model is superb simply because it is anchored with extreme values for the predicted Y, with relatively little obstruction coming from the middle-range values. In short, there are two distinct voting clans that dominate the model. Hence, if Segal-Cover scores were perfectly true (using a one-to-one correspondence), the reality that would exist would probably best be described with the following statement: “Rehnquist votes the way he does because he is extremely conservative; Marshall voted the way he did because he was extremely liberal.” (Segal and Spaeth, 2002, 86; 1993, 65).

There is still one disturbing objection, however: isn’t it ridiculous to have a hypothetical model where Justice Scalia never votes liberal? My answer at this point is to hedge a bit: this was only a hypothetical exercise. Because some may believe that a better model of perfect prediction should be something less than a one-to-one correspondence, I will adjust the numbers tonight and post a second analysis. I’ve got an idea of what to do.
Data: http://ludwig.squarespace.com/file-download/segal-cover.perfectpred.dta
[1] Segal-Cover scores “count” from -1 to +1, which is 200 increments. The liberal ratings “count” from 0 to 100, which is 100 increments. To scale the Segal-Cover scores, simply transform them by the formula 1 – (.5 - (score/2)).
[2] So long, of course, as the propensity for political direction remained constant in the values of a justice throughout his or her term on the bench, and so long as the dichotomous vote-coding construct used by political scientists accurately captured its subject (a controversial proposition that I have not yet addressed).
[3]. It is extremely rare for a bivariate ideological model to achieve a value of R2L above .4. In the hundreds of bivariate regressions I have performed, I have never seen a value that high. Therefore, I would suggest that at the outset researchers involved in bivariate ideology models adopt a simple rule of thumb: R2L values between .2 and .4 are “quite good results” and values below .1 are a baseline for results that are “not so good.”
[4] The relationship between the discreet change in the probability of Y for each 10% increase in X does not appear to be linear, however. For some 10% changes in X, the discreet change in the probability of Y is more extreme than for other 10% increments. The KDV reported in the table is the sum of all of these changes.