The Truth About "Newspaper Ideology" and Civil Liberties Voting, 1946-2004
 Thursday, June 22, 2006 at 6:34PM
 [Version 2.0]*
I have just spent a week laying out an indictment against the bivariate ideology models that political scientists constructed over the last sixteen years. The indictment is predicated on a basic point: the aggregation of voting data and resulting misinterpretation of the R-squared statistic caused the creation of disciplinary misinformation – empirical falsehoods, plain and simple, that were passed along to political science graduate students and the rest of the academic community. Now is the time to correct these falsehoods by constructing a bivariate ideology model that avoids ecological inference and correctly estimates the relationship between model variables.
First, however, keep in mind a couple of things. I have yet to say anything about the propriety of the measures in these models. Some have said that the stuffing of justice opinions into one of two binary outcomes – liberal or conservative – or the fitting of justices’ preferences in unidimentional space is too simplistic to merit serious consideration. I will visit these issues at a later date. But for now, all that I want to do is find a more simplistic truth: how well do these measures actually perform when researchers model them properly and understand the results?
Below are the results of a logistic regression of civil liberties voting from 1946 to 2004. The regression contains 31,049 votes cast by 32 justices over 58 years of service on the high Court. The data is publicly available from the Ulmer project. [1] Let’s discuss goodness-of-fit first. The first indication that the fit of the model is poor is the rather low value (0.067) of the likelihood ratio R-squared. [2] The second indication that the fit is not that great comes from the PRE measures. Of the three that are listed, tau-p is the best for judicial modeling. [3] Tau-p indicates that the model only increases the ability classify liberal votes by 24%. Also, Phi-p, which is calculated using the logic of Pearson’s r, suggests that the overal variance between Segal-Cover scores and justice votes is about 24% The table can be accessed here.
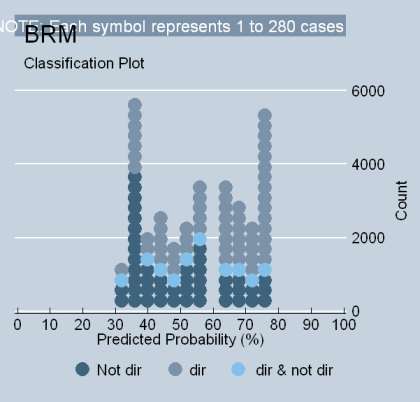
Although analyzing the goodness of fit of a logit regression may not be as easy as an OLS regression, one of the nice things is that both now have the ability to generate a "picture." Take a look at the STATA “classplot” below. It shows why the fit of the model is not very satisfying. The reason is twofold: (1) too many justices are simply “non-directional” (median justices who do not affiliate well with dichotomous choices pull down the model’s fit); and (2) there is not enough “gusto” coming from each end of the value spectrum (no one is predicted to vote in the very extreme ranges of 0 to 29, or 80-100). In short, there is too much traffic around the value of 50% and not enough around 20 or 80. That’s why the numbers are poor.

Now let’s look at the coefficient. I like to focus on what I call the "key" discreet change or value (KDV). This statistic shows the total discreet amount that predicted ratings change as Segal-Cover scores change from their minimum to maximum values. Hence, going from absolute conservatism (-1) to absolute liberalism (+1) -- a 100% change – causes predicted liberal ratings to increase by 41 points, less than half the proportion of the change in values.[i] Stated another way, newspaper reputation is less than half of the story, even using coefficient logic. And although these results may be perfectly acceptable to some – they certainly seem to fit a Pritchett framework -- it is quite clear as an empirical matter that they do not: (a) explain the bulk of choices justices cast in civil liberties cases; or (b) establish the mythology of judging by showing the supremacy of political values. Therefore, the ultimate point is that the reputation a justices obtains for political direction at the time of his or her confirmation does not explain nearly as much of the voting universe as the political scientists who originally constructed or endorsed these models proclaimed. This conclusion is not a matter of opinion; it is true as a simple fact of how data is interpreted and analyzed in a statistical model.
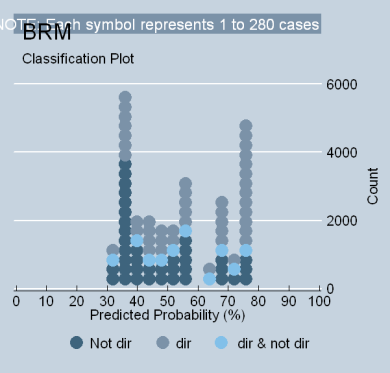
Because some scholars (Segal at al., 1995) believe that ideology models perform better when eliminating justices who predate the Warren Court, it is necessary to consider models that exclude Truman and Roosevelt appointees (the “truncated model”). The findings are found in Table 4 of my SSRN paper. It indicates that the truncated model is really no different from the model that contains all of the justices. The fit is poor (0.070 R2L); the increase in the ability to classify liberal votes is moderate (24%, tau-p); and the total voting variance is about 24% (phi-p). The predicted magnitude of the variable relationship is also roughly equal to a model containing all of the justices (KDV = .418). The classplot below is virtually indistinguishable from the preceding one. Although it is true that a higher proportion of index variance is present in the shorter list of ratings, only 14.6% of the model votes drive this effect (see Table 8 in my SSRN paper) [ii] and only five justices are responsible for half of it. [iii] Therefore, the substantive conclusions drawn from a model of a truncated set of justices is really no different from the full model.

REFERENCES:
Menard, Scott. 2002. Applied Logistic Regression Analysis. Thousand Oaks: Sage Publications. 20-27.
Kleckla, W.R. (1980). Discriminant Analysis. Thousand Oaks: Sage Publications. 7-19.
DeMaris, Alfred. 1992. Logit Modeling, Practical Applications. Thousand Oaks: Sage Publications. 53-54.
[1] My particular data set is an integration of the Vinson Court data and the original Supreme Court data (updated through 2004). I transformed the data into a single “justice-centered” set with the help of Paul Collins.
[2] R2L is sometimes called “the McFadden R2.” According to Menard (2002), the statistic has the desirable properties of running from 0 (no fit) to 1 (perfect fit), is not affected by the proportion of cases in the sample having the attribute 0 or 1 (called the “base rate), and is not affected by the sample size of the data. However, it is important to remember that R2L is only an analogue to the OLS R2; the two statistics cannot be directly compared. Clearly, R2L underestimates goodness-of-fit when compared to OLS estimations of continuous-level data (DeMaris 1992, 53-54), and cannot be considered itself an explanation of overall voting variance (Menard, 20-24). It is extremely rare, moreover, for a bivariate ideology model to achieve a value of R2L above .4. In the hundreds of bivariate regressions I have performed, I have never seen a value that high. Therefore, I would suggest that researchers involved in bivariate ideology models adopt a simple rule of thumb: R2L values between .2 and .4 are “quite good results” and values below .1 are a baseline for results that are “not so good.”
[3] Based upon Menard’s (2002, 32-34, 36) reasoning, lambda appears inappropriate for a bivariate ideology model because it assumes that errors without the model take the form of an all-or-nothing guess (Menard, 29). In essence, lambda would only be helpful as a PRE measure if modelers could theoretically make the assumption that in the absence of any knowledge of their X variable, every justice in their sample of cases would vote unanimously in every case, the entire sample being all liberal or all conservative. Obviously, this does not appear to be a reasonable assumption.The measure that is best, therefore, for judicial politics scholars is Klecka’s (1980) index originally proposed for use in discriminant analysis models, generally referred to as “tau.” Following Menard’s terminology (2002, 32), I denote the term “tau” with a “p” – tau-p – to indicate its application to a 2 x 2 prediction table generated by a logit model. Tau-p is simply the best PRE statistic for judicial modelers because it assumes that the goal of the logit model is simply to classify as many liberal/conservative votes that are actually found in the base rate of the sample. Therefore, tau-p does not assume an all-or-nothing guessing scenario. It assumes that the number of liberal and conservative votes to be “guessed” in the absence of knowledge about the values of X is simply the proportion of liberal and conservative votes actually present in the sample. In this sense, Menard says that tau-p is less concerned with prediction logic and more concerned with classification logic. (29,33). Of course, like all PRE statistics, tau-p becomes problematic if data becomes excessively skewed.
[i] But how accurate are these predictions? Regressing the predicted liberal score of each justice against the actual ratings produces an R-squared of .4081, indicating that the logit predictions account for roughly 41% of the index variance. (Table 4 lists this statistic as “ppeR2,” which refers to “predicted probability R2”). Note that this is the same amount of index variance reduced in the ecological model. But note also how misleading this can be: As Table 8 shows, the ecological model only uses 12.5% of the Court’s votes to explain 41% of the index variance. And as both the logit model and Table 7 shows, there does not appear to be much overall political direction in the index in the first place.
[ii] Table 8 analyzes the explained and unexplained variance in the ecological model’s R-squared. As one can plainly see, the number of votes that accompany the explained portion of the regression is only 12.5% for the full model and 14.6% for the truncated model.
[iii] Note on Table 8 that only five extreme justices – Brennan, Fortas, Marshall, Scalia and Rehnquist – contribute 56% of the truncated model’s R2. When compared to the full model, however, those same justices cannot carry such “loads” – they account for only 37% of the explained variance.
* substantial editing.
Reader Comments